Less entry,
more insight
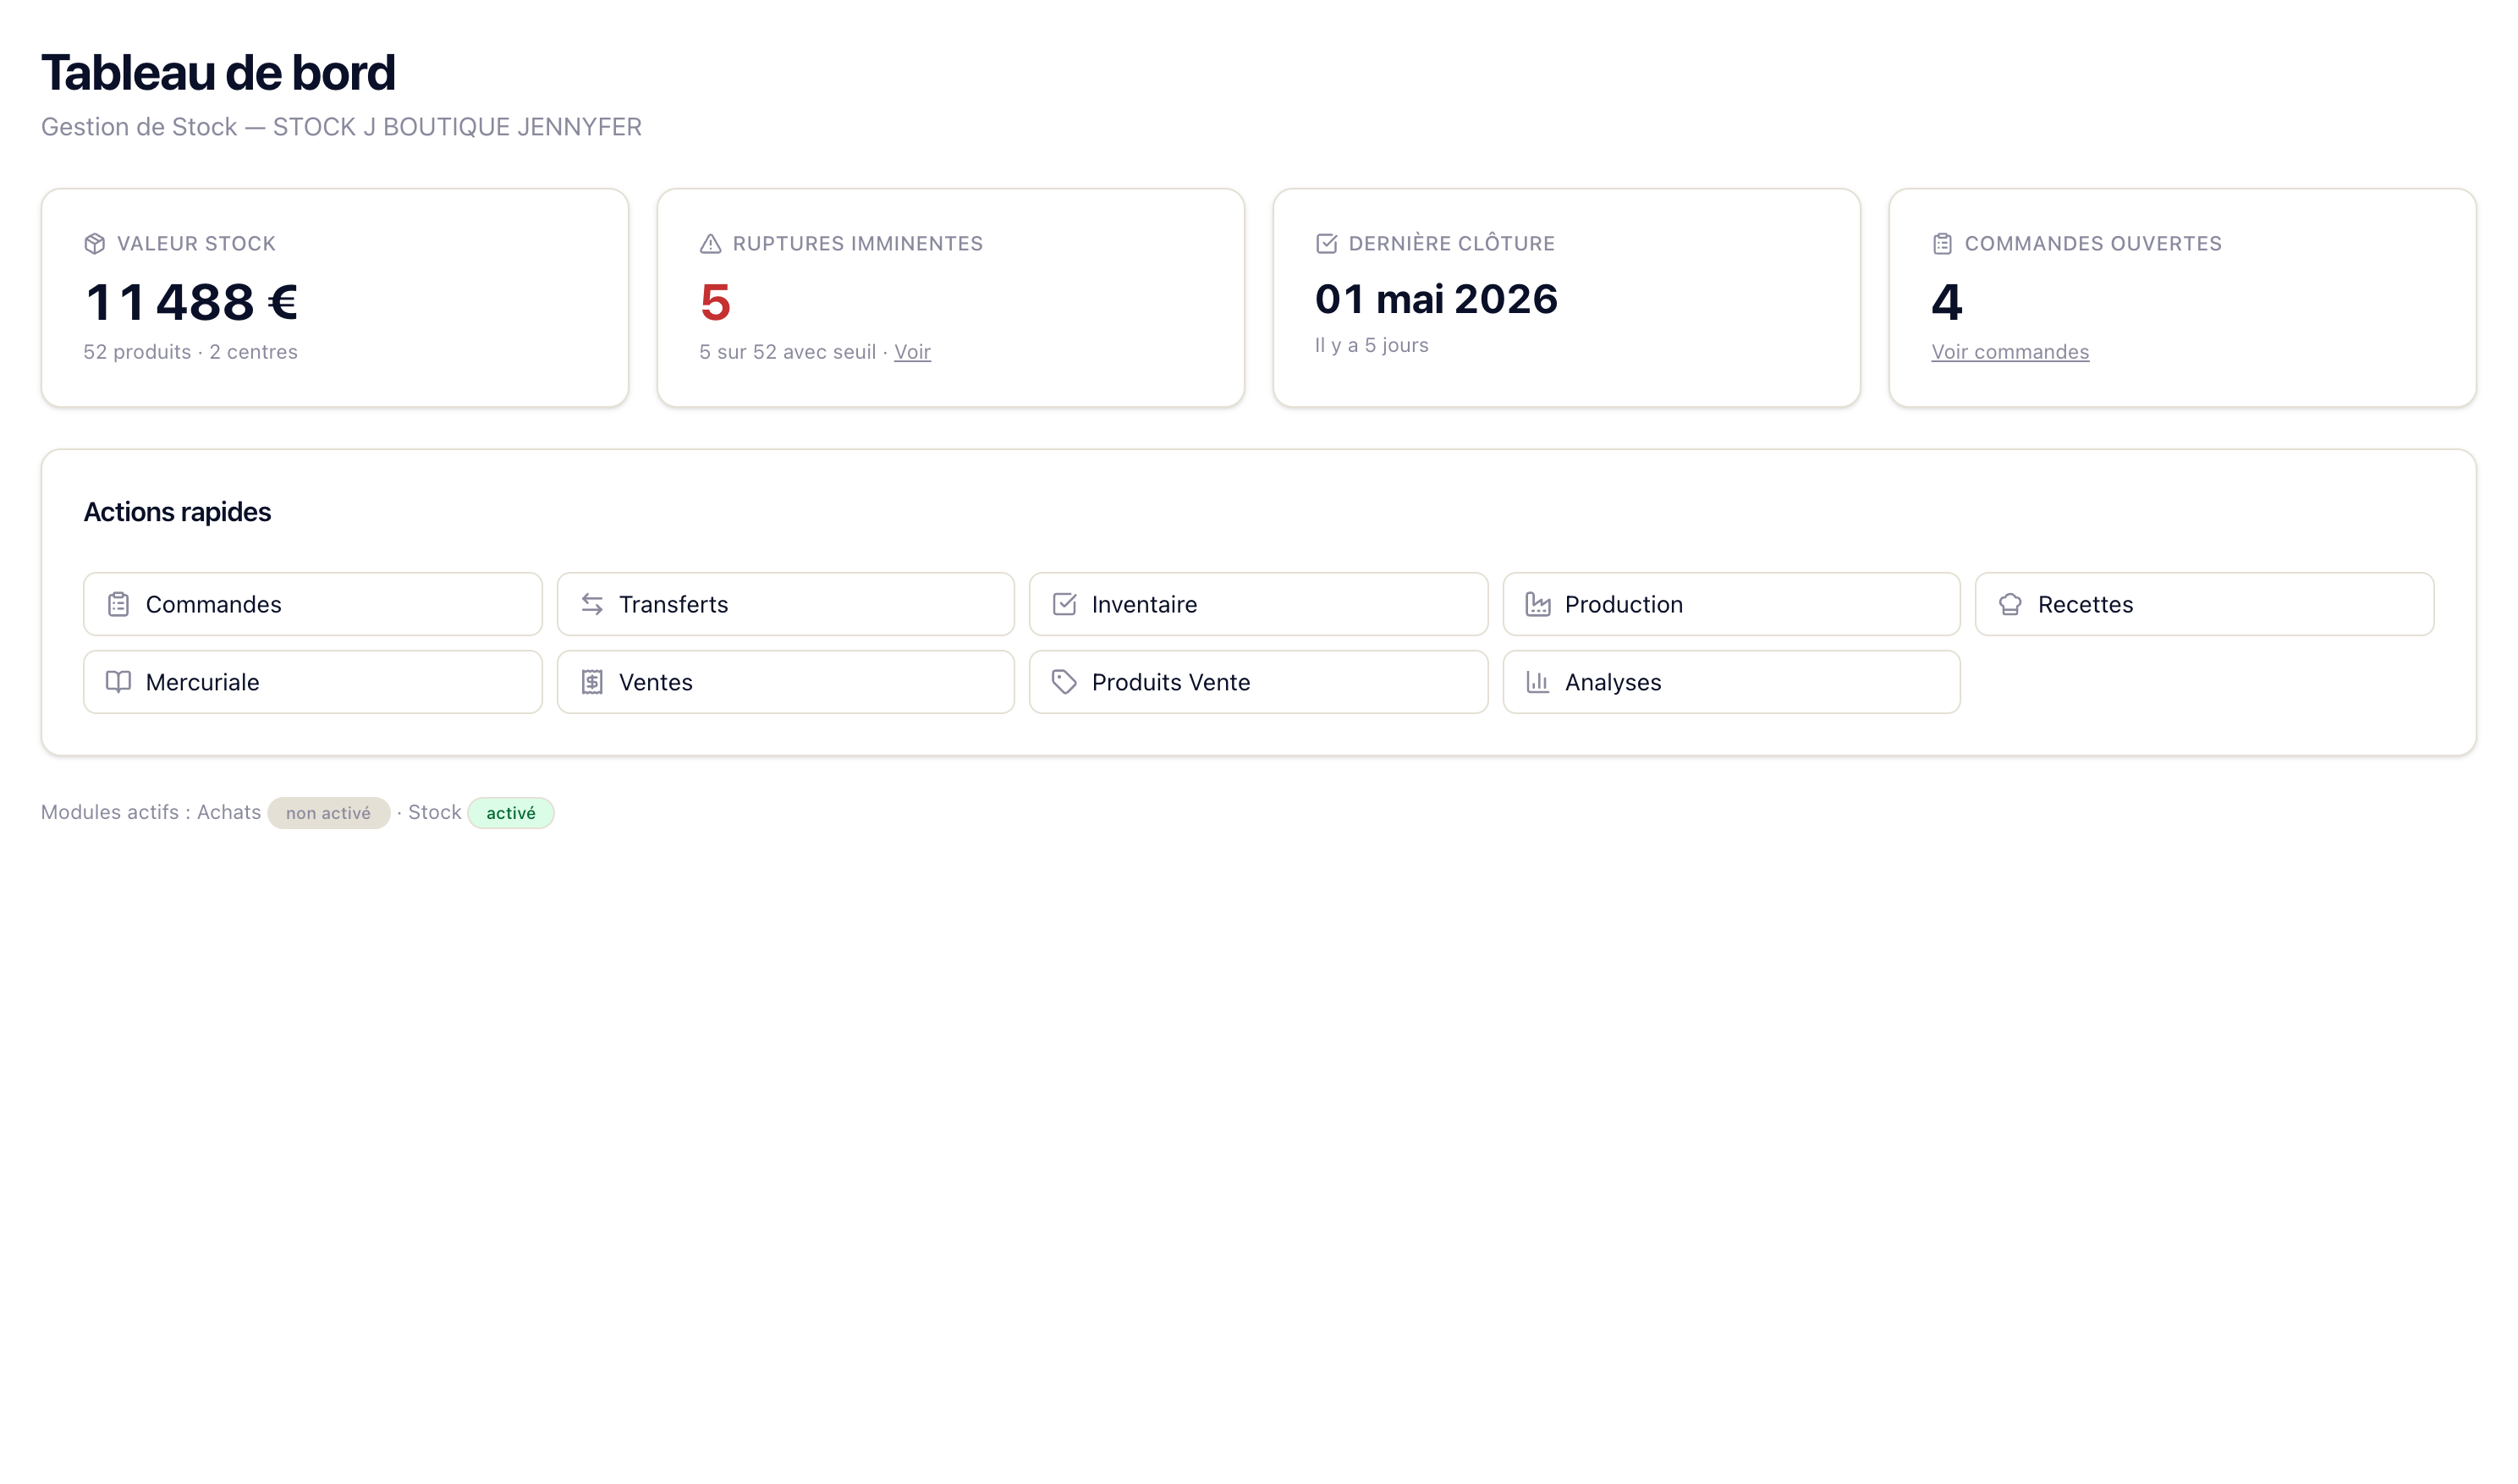
Steer your stock at a glance
Today's stock value, imminent stock-outs, last inventory closure, open orders — the essential indicators displayed on arrival in the morning. Direct shortcuts to today's actions: new entry, new transfer, new order. Automatic computation across all your centres.
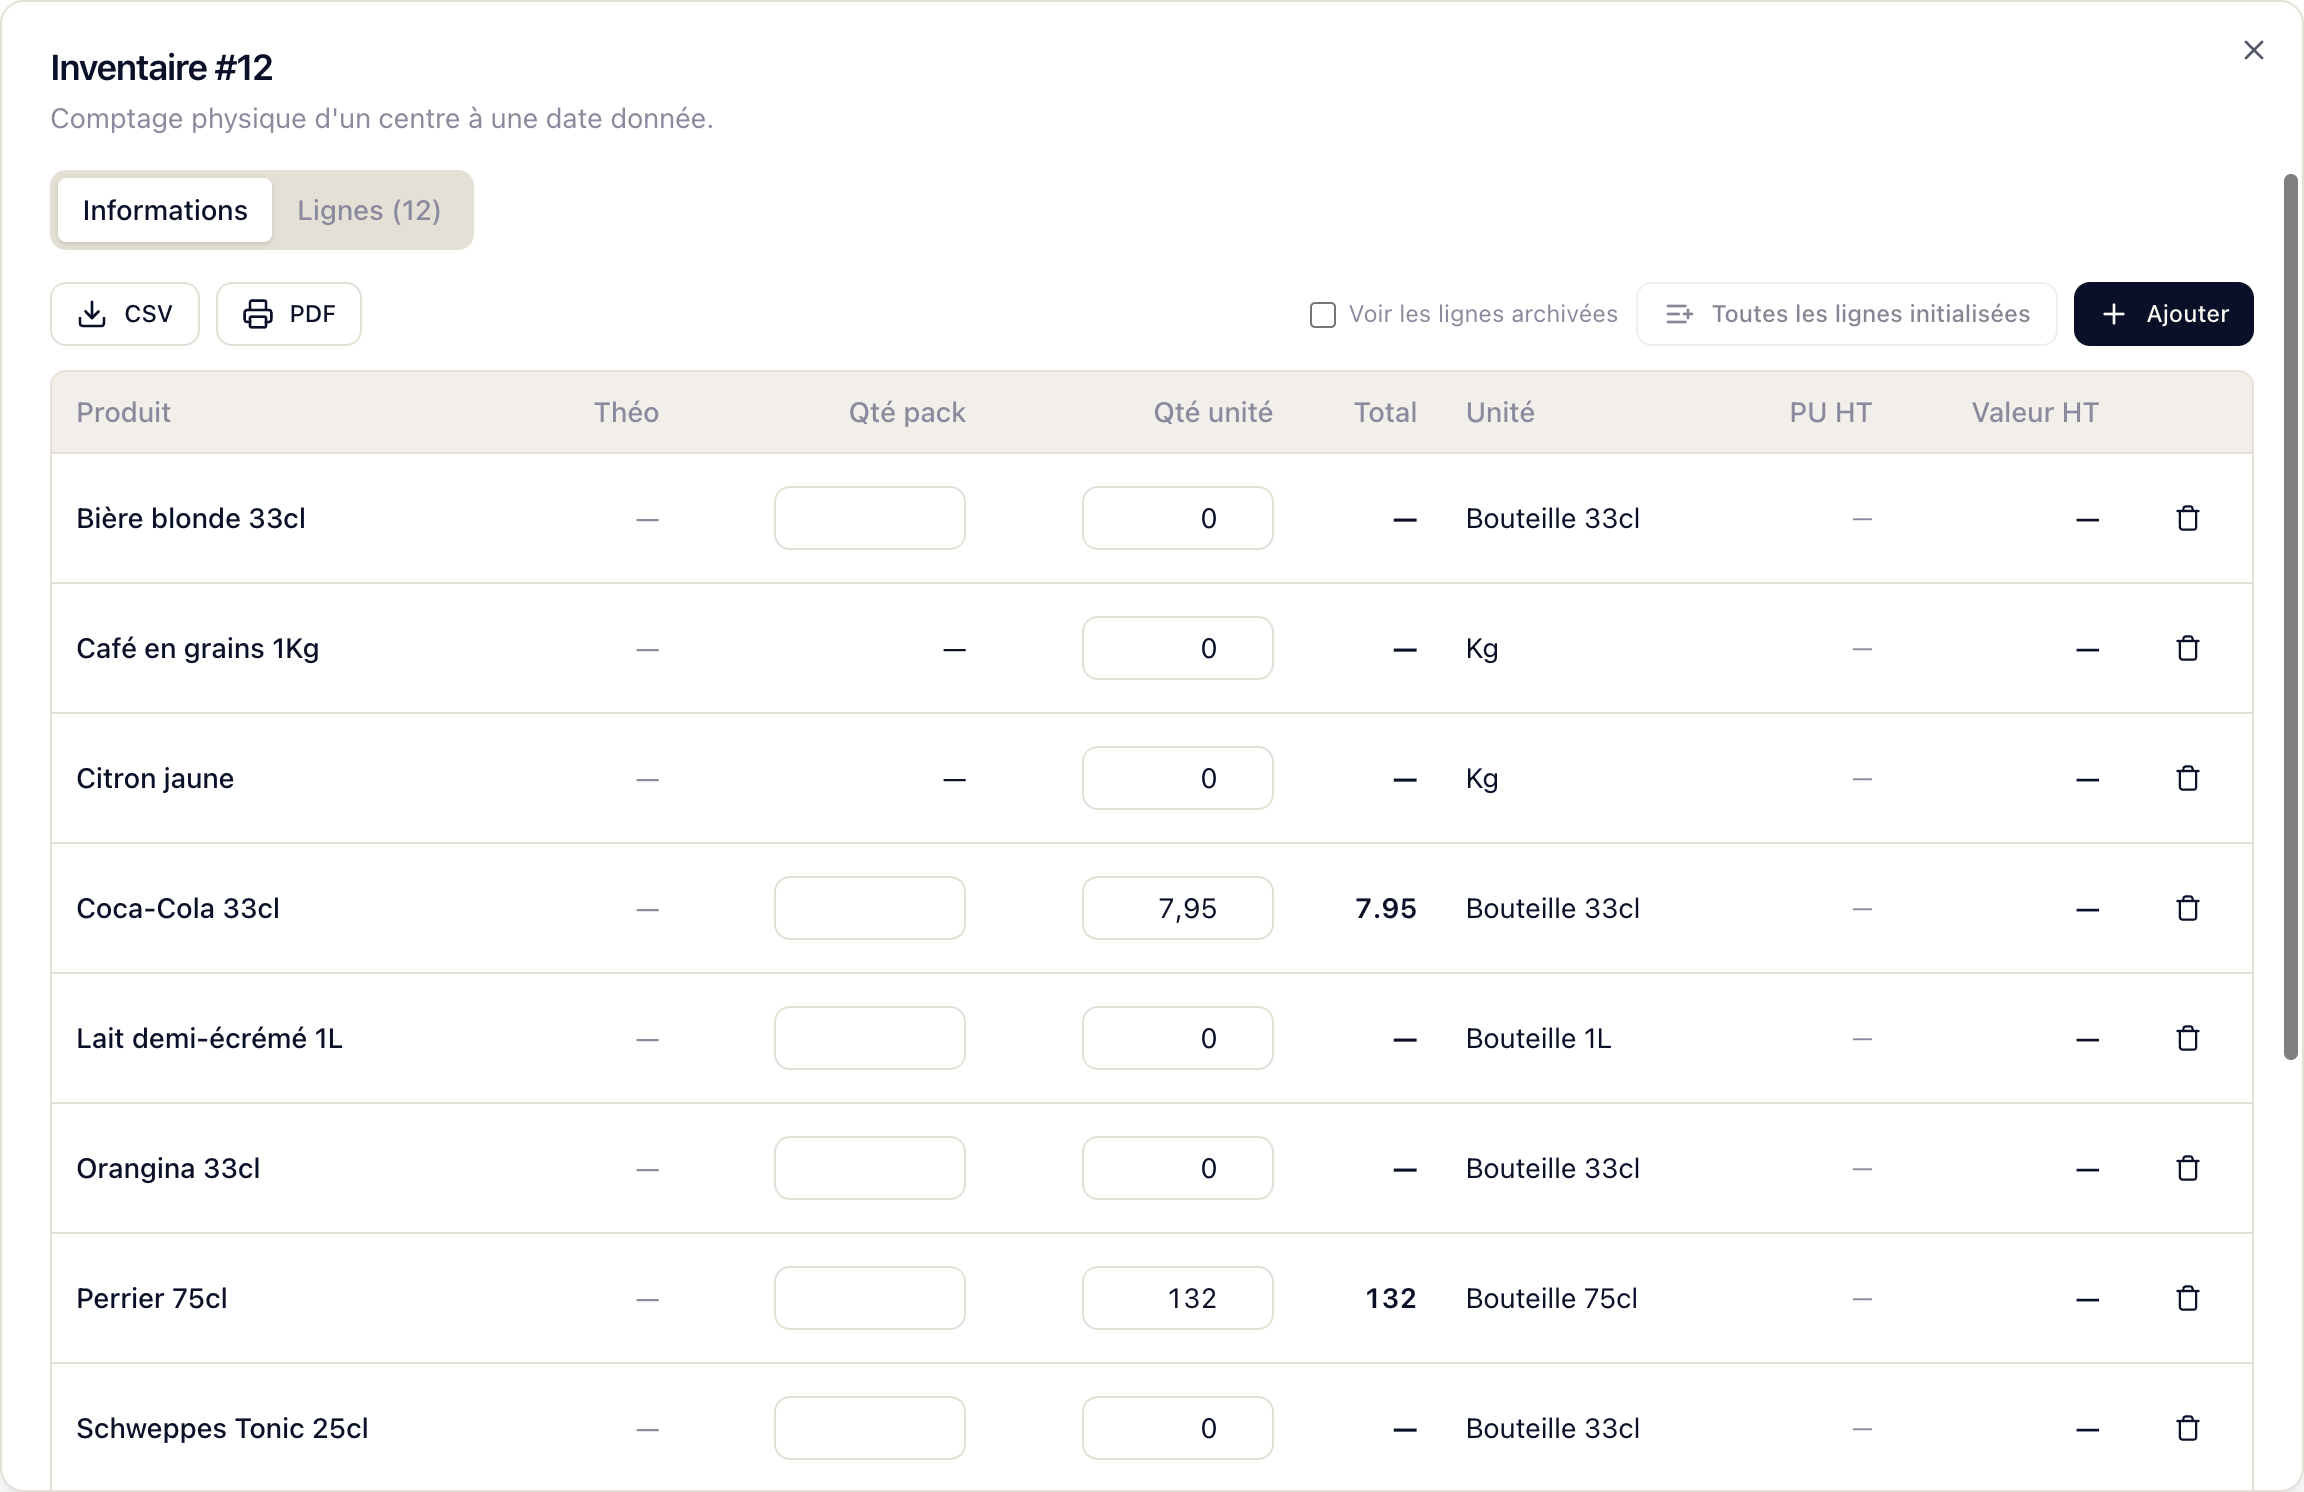
Tablet inventory, by zone
Count physically once a month, the app computes variance automatically. Initialise all lines in one click. Inline entry, Tab to validate — built to move fast on a tablet in the cellar. Total valuation computed using your average-price method.
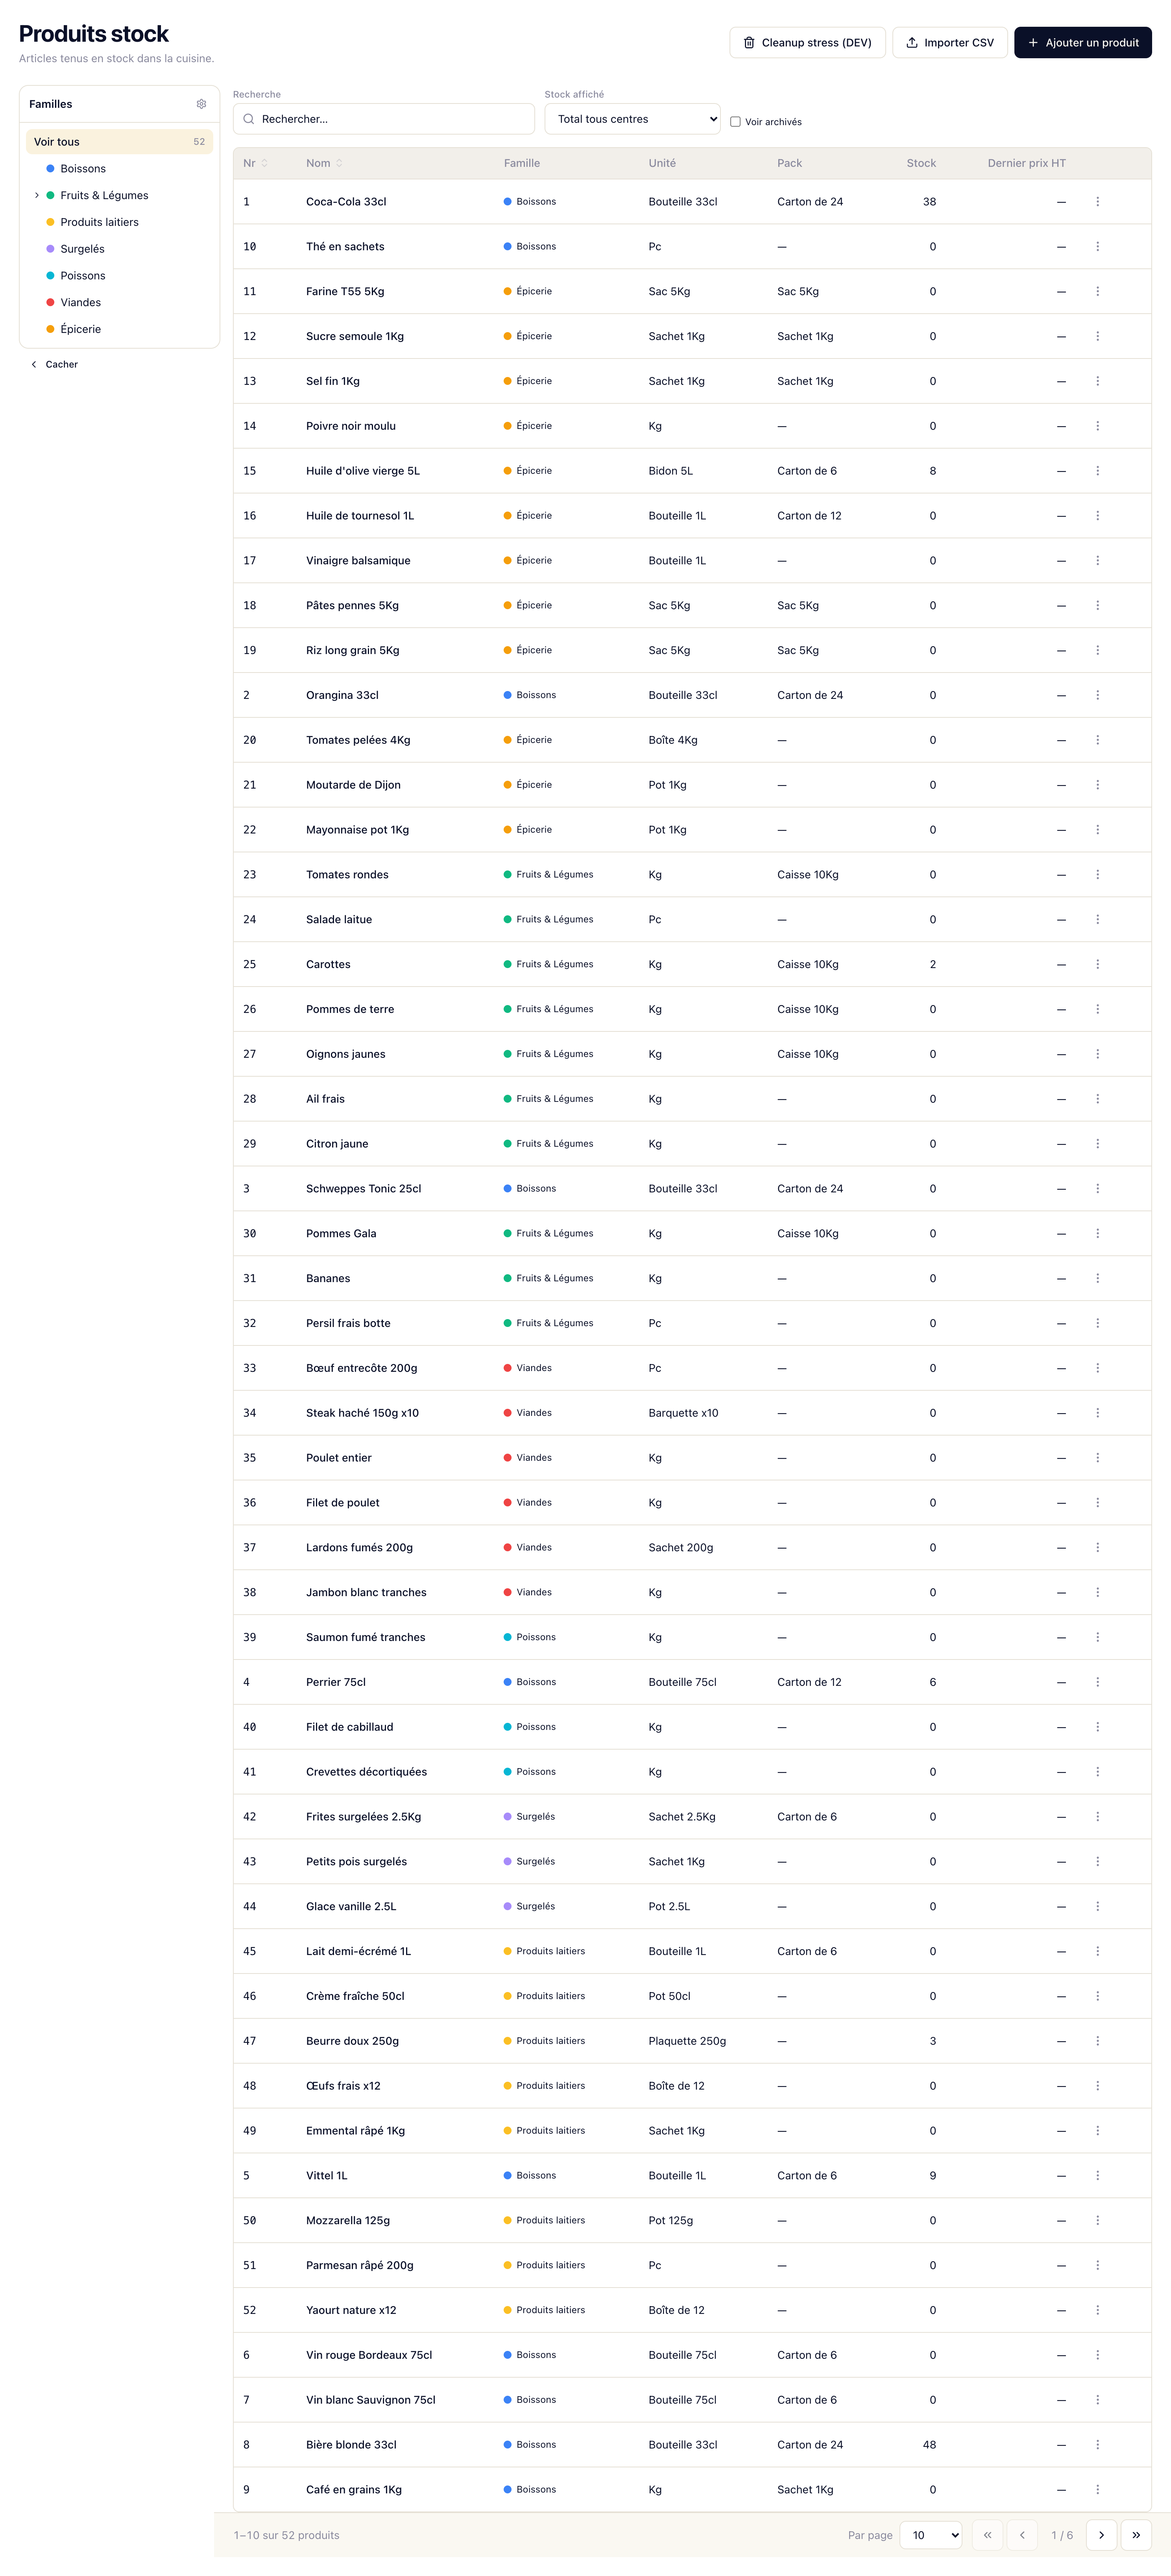
All your refs in one filterable screen
Instant filtering by family, centre and keyword — no more digging in Excel. Current stock computed live from movements, so it matches accounting reality. CSV import / export to bulk-load or audit from a maintained file.
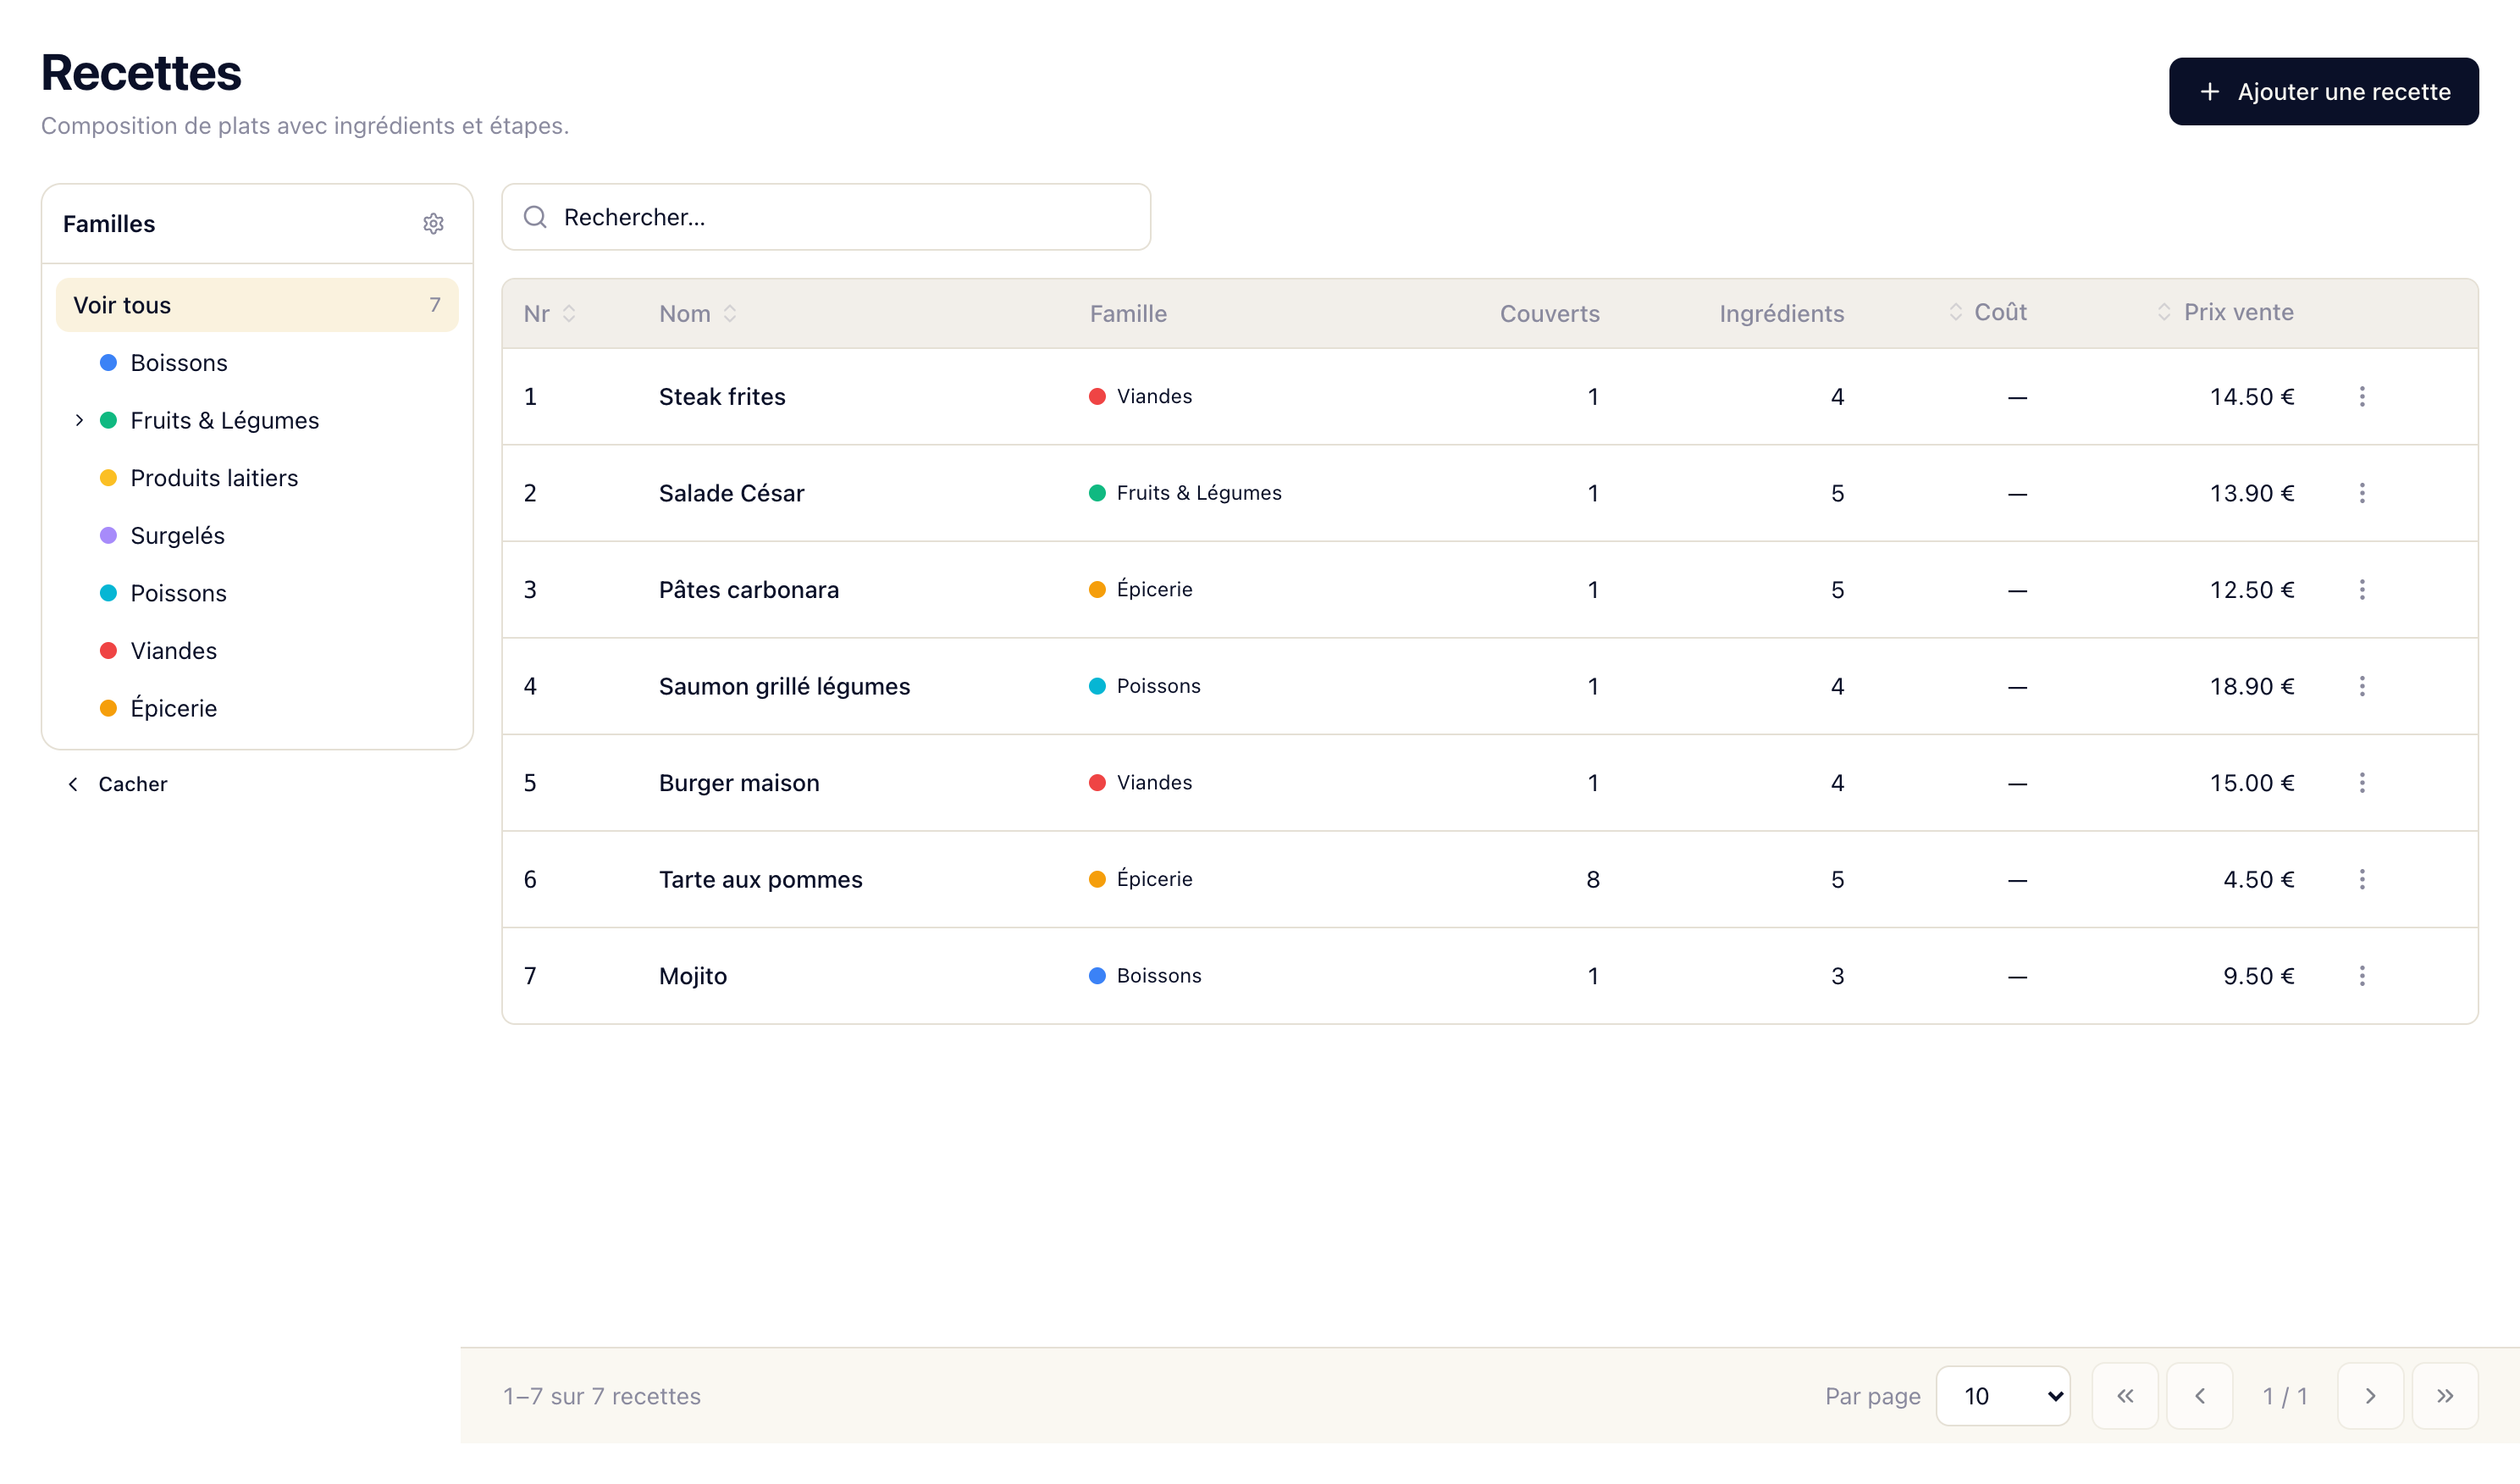
Tech sheets, sub-recipes, food cost
Centralise your tech sheets with food cost computed in real time. Filterable list per dish family and per cost. Auto-update of food cost the moment a purchase price changes — no need to redo your sheets one by one. Sort by gross margin to spot your most profitable lines.
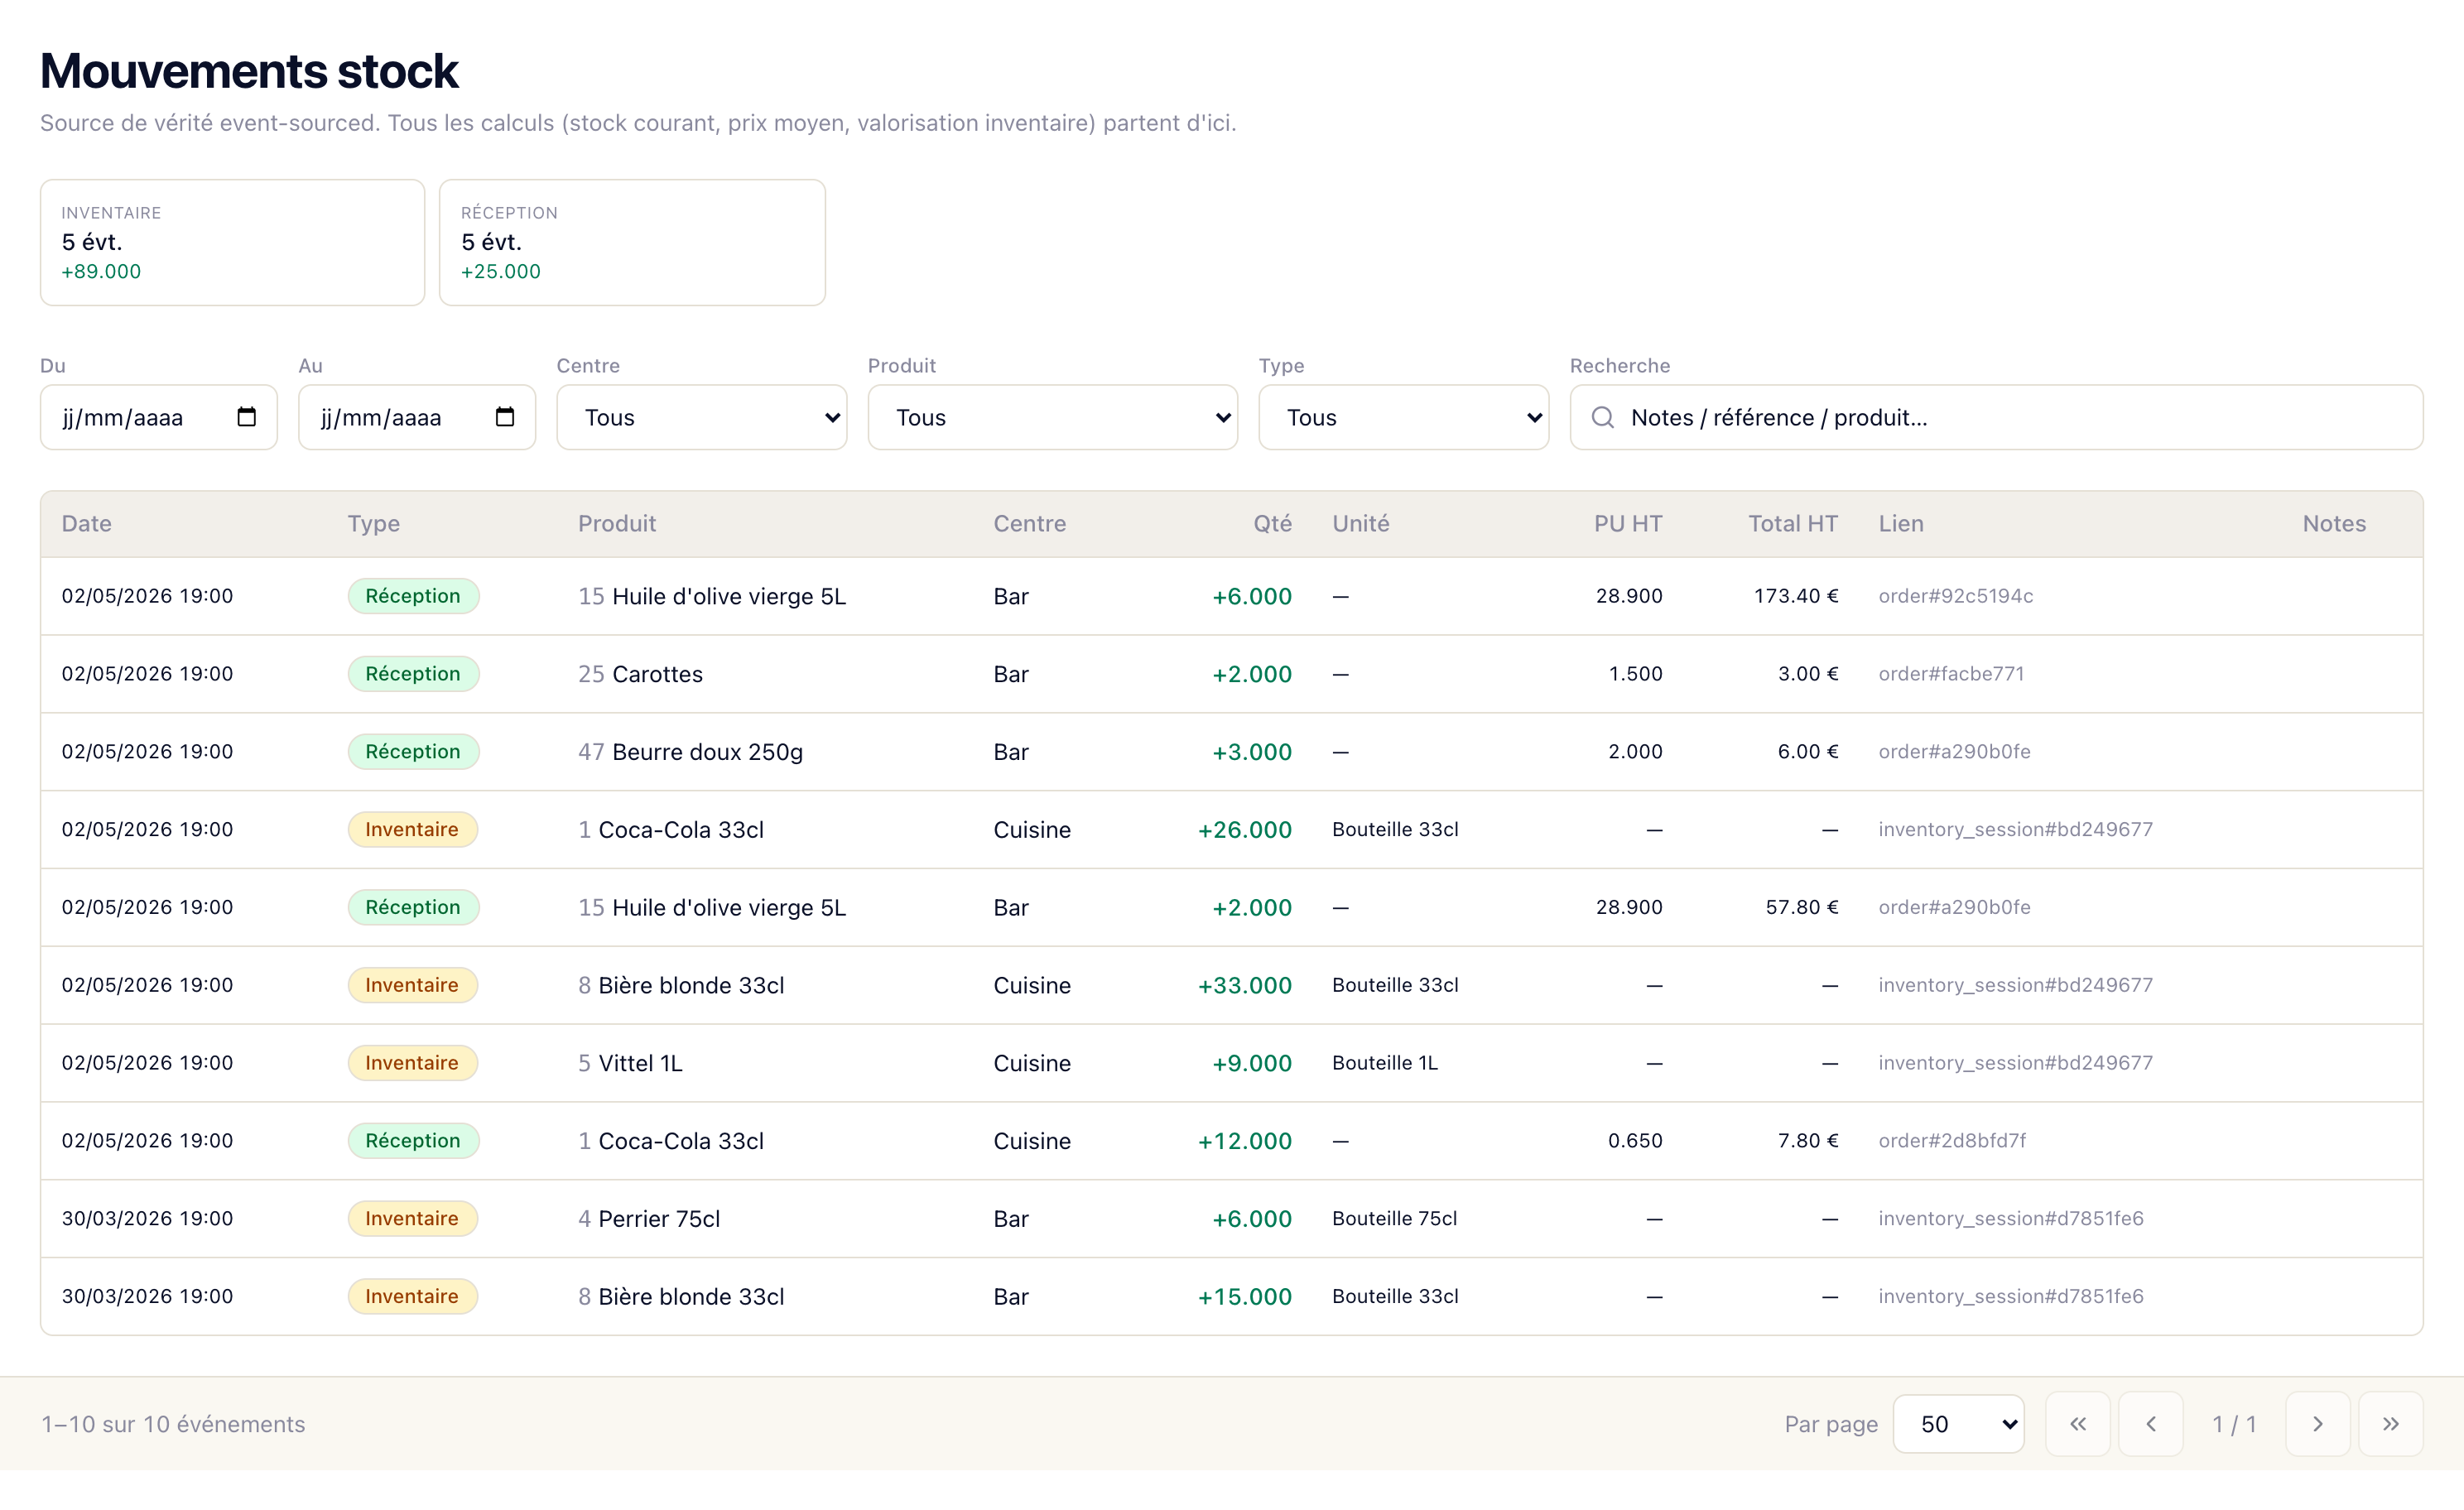
Your stock's full history, traceable
Purchases, sales, transfers, inventory adjustments — everything in one filterable table. Fiscal source of truth: every movement is immutable, timestamped and tied to a business event. Powerful filters (date, centre, product, type) to answer an auditor in seconds.
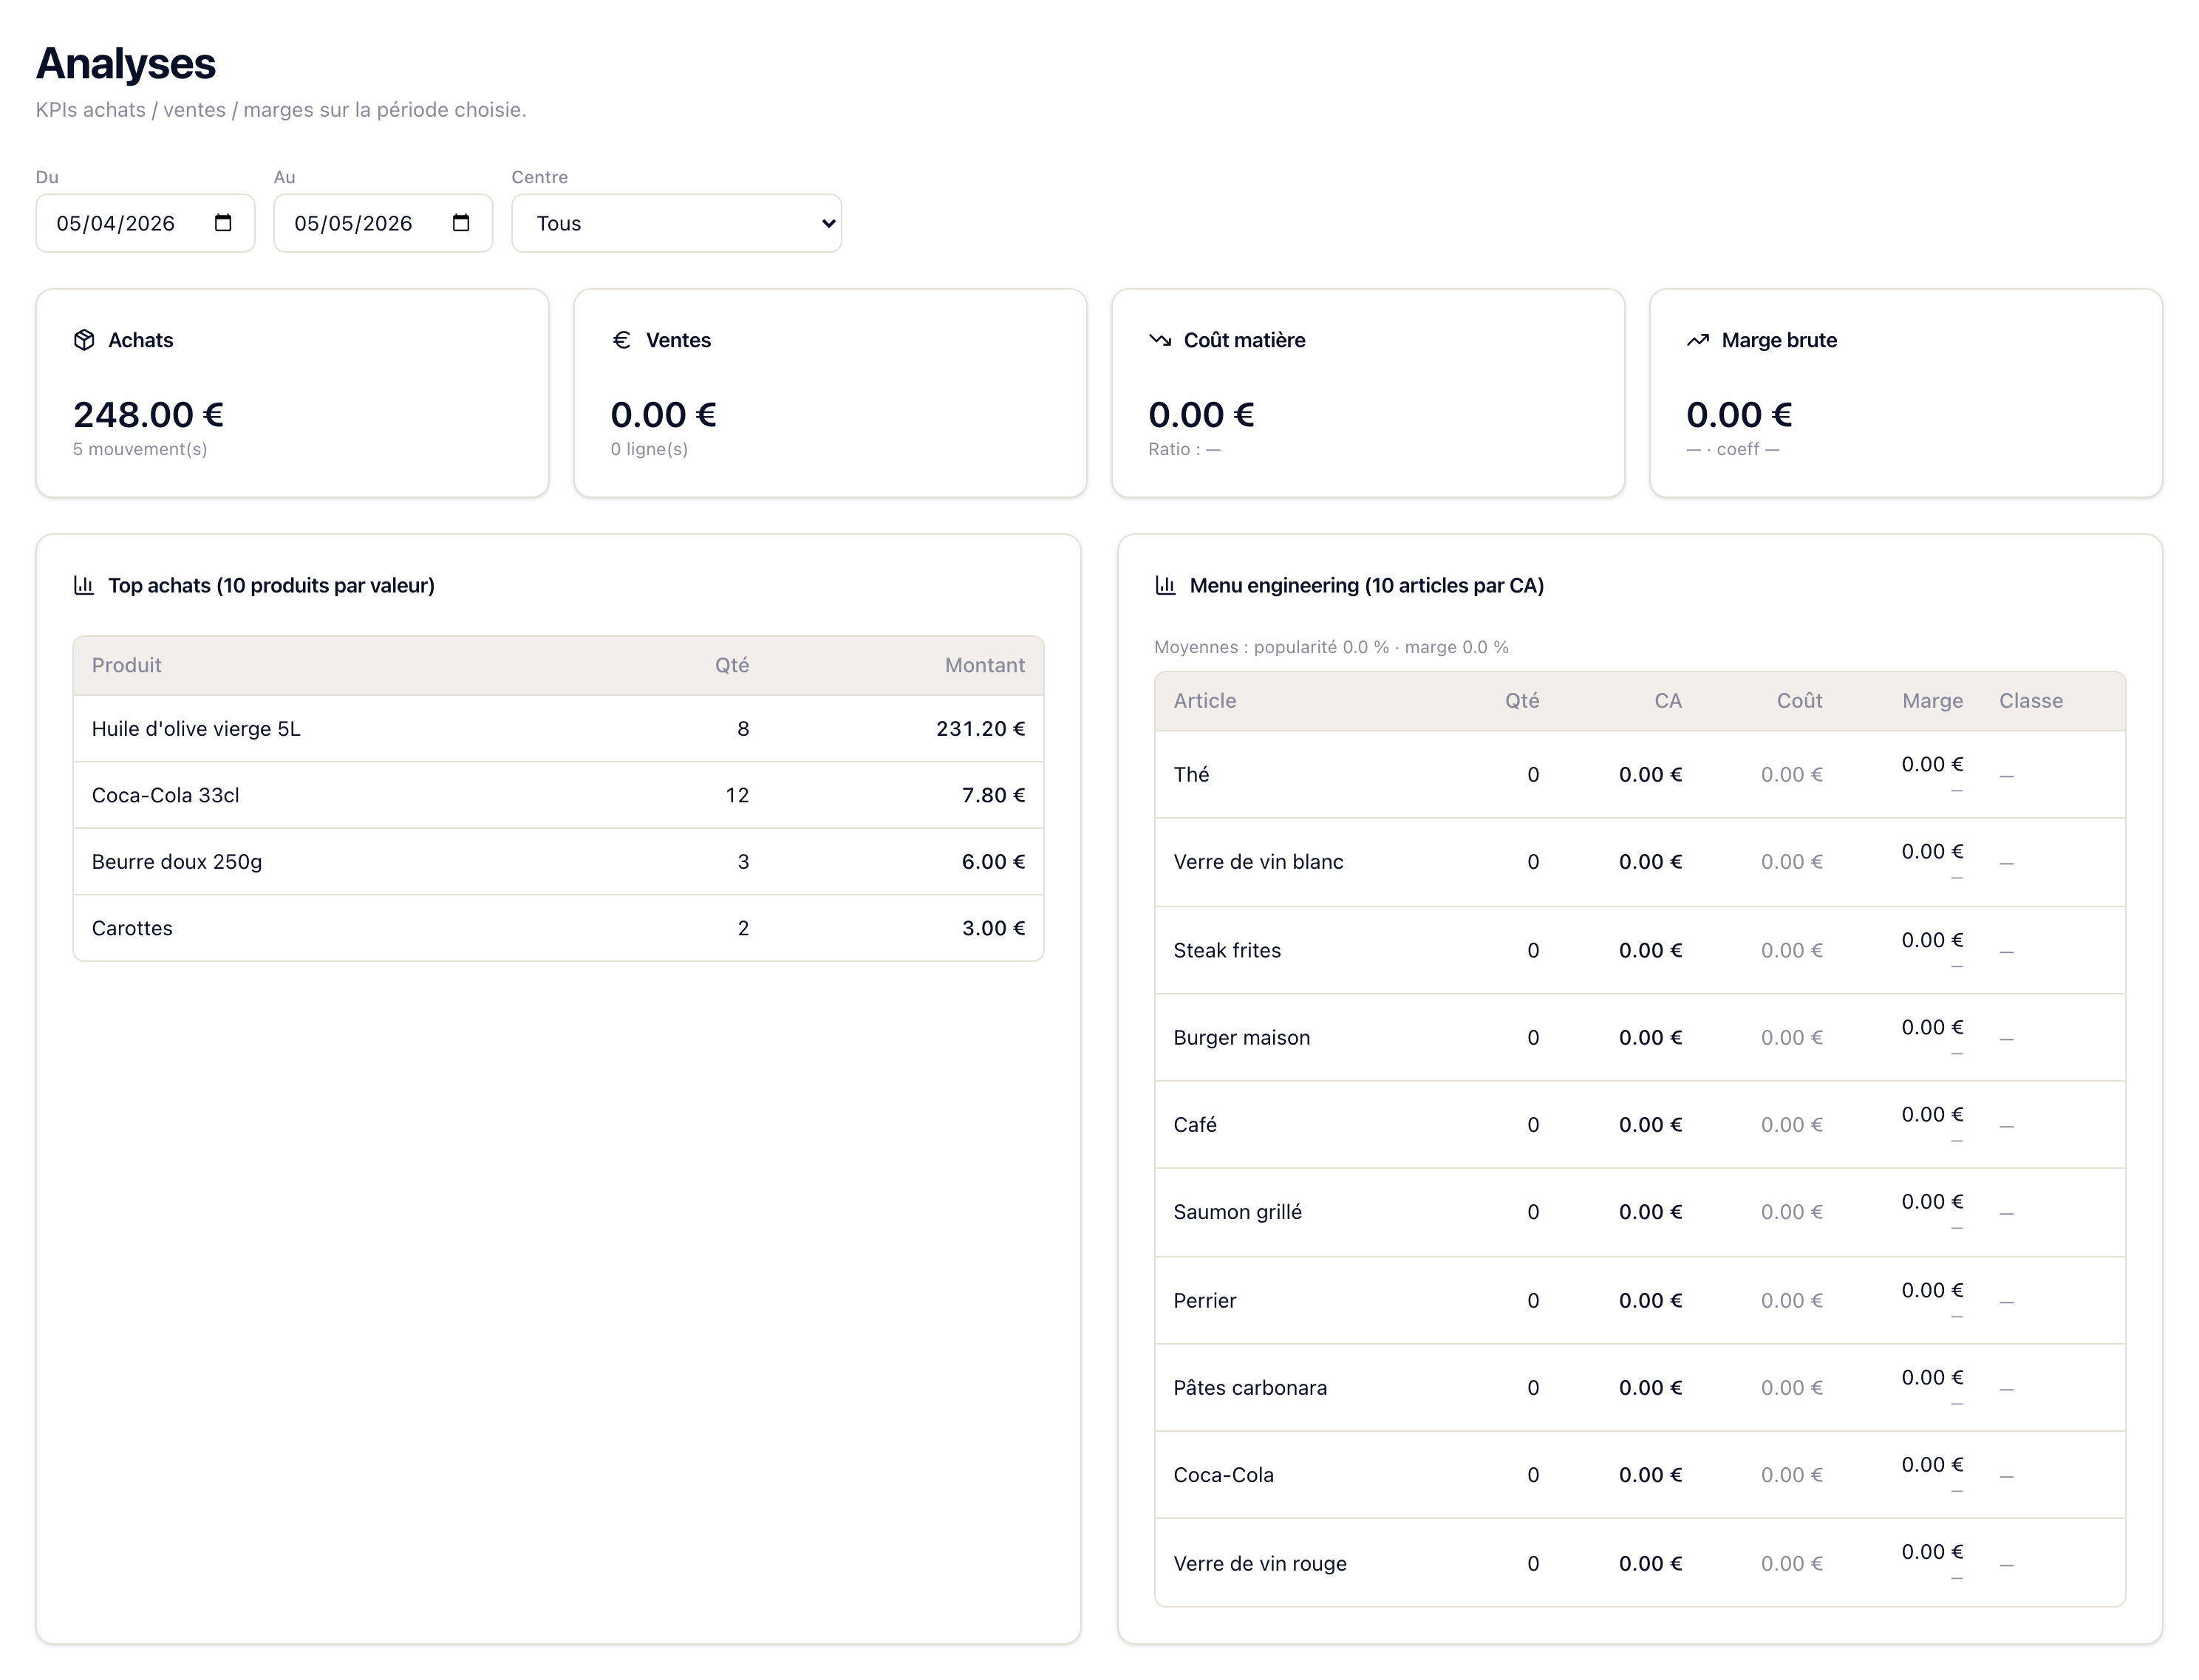
Understand what's eating your margin
Month-over-month food cost evolution to catch drift before it hurts. Top 10 products that rose the most over the period, to re-arbitrate suppliers. Purchases-vs-sales comparison to detect variance, losses and waste.